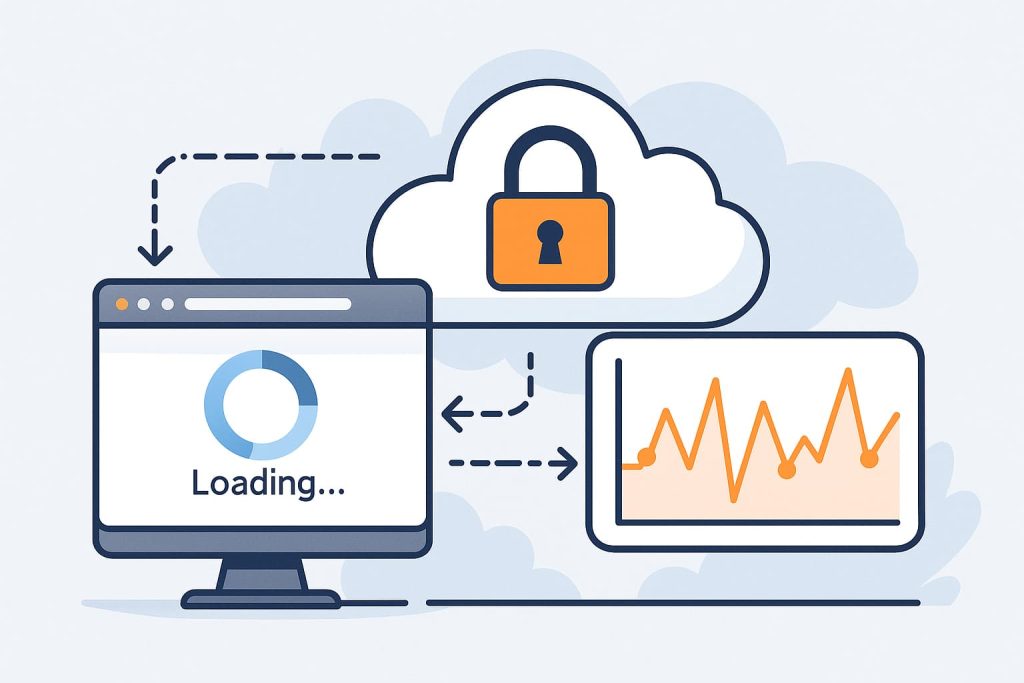
Why Do Some “Normal” Responses Still Feel a Split-Second Slower Than Expected?
You send a request, the server responds with a clean 200 status, nothing looks wrong in the headers, and network timing seems acceptable. Yet something about the response feels slightly delayed — not enough to break functionality, but enough for a developer or power user to notice.
This subtle slowdown is more common than most people assume. It isn’t usually caused by trust issues, verification challenges, or explicit throttling. Instead, it often emerges from timing behavior inside the transport pipeline, invisible processing layers, and contextual conditions that don’t appear in surface-level request traces.
Understanding these small timing gaps is important, especially for teams monitoring micro-latency. Tools like CloudBypass API help uncover these invisible timing layers by mapping request behavior across regions, hops, and timing phases — allowing developers to observe patterns that traditional logs cannot reveal.
This article explores why a request that looks normal may still feel just a fraction slower, and why these micro-delays happen even when everything appears healthy.
1. Micro-Scheduling Delays Inside Network Middleware
Modern edge networks use shared scheduling queues.
Even when traffic is light, internal schedulers may create subtle delays caused by:
- queue reshuffling
- micro-bundling of packets
- internal prioritization
- resource arbitration cycles
These delays rarely exceed a few milliseconds, but they accumulate just enough for humans — especially developers — to sense them. They never show up in the response body or classic metrics, but they add a faint hesitation you can feel.
2. Invisible Reprocessing at Transit Layers
Some networks reprocess packets at transit points even when everything seems normal. This reprocessing may include:
- re-evaluating routing hints
- protocol adaptation
- traffic normalization
- header reconciliation
- low-impact inspection passes
These operations don’t trigger warnings, don’t change the response, and don’t appear as errors — but they cost time. A normal-looking response may still have traveled through extra steps you can’t see.

3. Embedded Latency from Multi-Path Routing
Multiple network paths can exist between you and a server. Even when the selected route performs well, routing algorithms sometimes insert tiny delays to maintain:
- congestion balance
- path stability
- inter-node synchronization
- network fairness policies
This may produce a response that looks identical to a faster one but arrives slightly later because of timing adjustments deep inside the routing fabric.
4. Background Tasks Triggered by the Request
Some servers run small background operations whenever you access certain endpoints. These are not heavy enough to cause major slowdown, but they add a perceptible micro-delay:
- session bookkeeping
- metadata refresh
- non-critical log writes
- incremental state updates
- backend routing recalculations
The frontend response is returned only after these tasks finish — so the page loads fine, but feels subtly slower.
5. Application-Level Pre-Rendering Differences
Even if the server returns content instantly, rendering latency can vary depending on:
- JavaScript execution order
- resource hydration behavior
- pre-render blocking tasks
- layout computation cycles
- timing alignment with the event loop
Everything still loads “correctly,” but the smallest render-blocking step can introduce a split-second delay that users feel but cannot easily diagnose.
6. Micro-Delays From Transport Layer Recovery
TCP and QUIC occasionally apply tiny corrective behaviors:
- packet smoothing
- congestion window rebalance
- timing correction after jitter
- retransmission speculation
- handshake optimizations
These events do not count as errors and don’t trigger visible instability, yet they alter how quickly a “normal” response reaches your device.
7. Environmental Conditions That Shift Timing Slightly
Some factors happen entirely on the client side:
- CPU scheduler load
- browser resource prioritization
- battery-based throttling
- memory state fluctuations
- Wi-Fi interference micro-bursts
None of these cause significant slowdown individually, but together they produce perceptible micro-lag inconsistent with the server’s raw performance.
How CloudBypass API Helps Make These Invisible Delays Measurable
While these timing drifts are subtle, they follow patterns.
CloudBypass API tracks:
- timing drift across multiple hops
- latency variance across edge regions
- background interference patterns
- micro-level pacing delays
- secondary request timing anomalies
It does not bypass protection systems; instead, it provides visibility into timing structures that traditional tools overlook. This gives developers a clearer picture of where delays originate — whether from network behavior, rendering stalls, or environmental drift.
A response can look perfectly normal while still feeling slightly slower because modern web delivery involves dozens of invisible timing layers — most of which operate silently in the background without altering the content or triggering alerts.
These micro-latency sources are subtle, intermittent, and often environmental rather than security-related. Recognizing them helps developers understand that not every delay originates from the server or protection system itself; sometimes, the slowdown emerges from the network fabric or the execution environment surrounding the request.
FAQ
1. Why do micro-delays occur even when latency and bandwidth look stable?
Because latency and bandwidth measure only high-level performance. Micro-delays come from timing layers, queue transitions, and subtle scheduling behavior invisible in summary metrics.
2. Can simple ping or speed tests detect these delays?
No. Ping shows round-trip time, and speed tests show throughput. Neither reflects micro-scheduling, pacing drift, or hidden processing stages.
3. Are these delays caused intentionally by servers?
In most cases, no. They typically occur due to routing adjustments, balancing cycles, or internal maintenance processes — not deliberate throttling.
4. Can client-side conditions cause the same symptoms?
Yes. Browser overhead, CPU load, memory conditions, and wireless interference can create lag that resembles network slowdown.
5. How can developers identify the exact layer causing the delay?
By analyzing DNS timing, handshake behavior, first-byte arrival, transfer phases, and rendering stages. Tools like CloudBypass API help isolate where micro-latency originates.