How to Tell If a Slowdown Is Caused by Node-Load Balance Gaps
Imagine this: you open a page you’ve tested hundreds of times, and everything should feel normal.
No spike in traffic, no unusual API patterns, no configuration changes — yet something in the loading sequence feels just a bit heavier than usual.
It’s not a full outage, not even a real slowdown, just an odd, inconsistent hesitation that appears and disappears without warning.
Many developers first assume routing issues, network congestion, or cache misses.
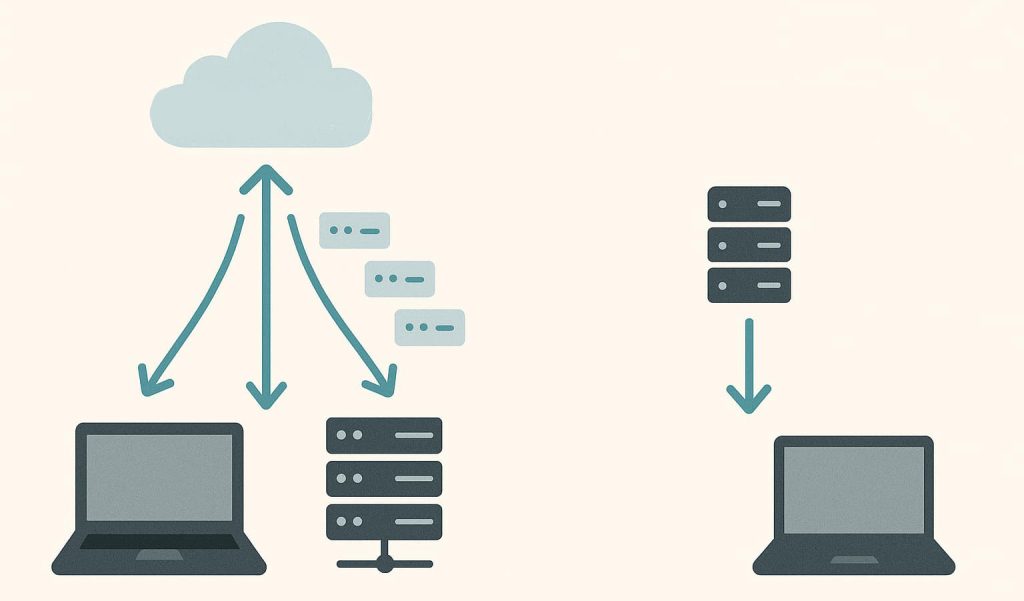
But one of the most common — and easily overlooked — causes is node-load balance gaps: tiny, uneven stretches in how traffic gets assigned across edge or backend nodes.
These gaps rarely show up in dashboards, yet they heavily influence perceived performance.
This guide breaks down how to tell when these load-balance gaps are responsible and how tools like CloudBypass API make these invisible asymmetries easier to see.
1. What Exactly Is a Node-Load Balance Gap?
Load balancers don’t distribute traffic perfectly evenly.
They try — but real-world conditions create micro-gaps caused by:
- local node cycles
- background compute tasks
- variance in per-node queue pressure
- slight timing differences in capacity updates
- region-specific handoff patterns
A “gap” is when one node is slightly more burdened than its neighbors, causing your request to land in the slower pipeline even though overall system load looks healthy.
2. Slowdowns Often Occur Only on Specific Request Types
Load-balance gaps rarely slow down everything.
They surface most clearly in:
- early handshake phases
- first request after idle break
- resource-fetch bursts
- multi-asset API batches
- TLS session reuse attempts
If one category feels slow but others don’t, you’re likely hitting node-level imbalance rather than global congestion.
3. Identical Requests Returning Slightly Different Completion Times
One of the classic signals is timing drift between “identical” requests:
- same URL
- same headers
- same method
- same timing conditions
Yet the load time wobbles by 50–150ms.
That wobble usually reflects per-node processing divergence — a hallmark of load-balance gaps.
CloudBypass API’s micro-timing snapshots help distinguish genuine drift from random jitter.

4. The Delay Appears Random — But Only Within a Specific Region
If the slowdown:
- occurs only in one region
- disappears when switching POPs
- does not appear in synthetic global tests
then the issue isn’t you — it’s a node-local imbalance.
Because each region manages its own node cluster, their load curves diverge even when traffic is stable.
5. Responses Feel “Heavy” Even Though Latency Looks Normal
Another subtle signal:
- TTFB stays stable
- total latency stays normal
- but resource sequencing feels delayed
This happens when nodes temporarily:
- reprioritize internal tasks
- refresh caches
- rotate queues
- adjust pacing windows
These internal behaviors don’t appear in basic latency metrics, but they slow the processing after the initial handshake.
6. Multi-Hop Requests Show More Drift Than Single-Hop
If multi-hop resources (images, widgets, JS assets) slow down while the main document stays fast, you’re likely seeing:
- node-to-node rebalancing events
- asynchronous slot adjustments
- intra-cluster contention
The slowdown isn’t in the routing layer — it’s happening inside the node cluster itself.
7. Slowdowns Sync With Node Maintenance Windows or Update Cycles
Many infrastructure systems apply:
- brief rolling updates
- per-node policy refresh
- cache rebuild cycles
- health-check realignment
These processes produce 1–5 second windows where load briefly shifts unevenly.
If slowdowns follow a repeating rhythm, you’re watching a maintenance-driven gap.
8. CloudBypass API Makes These Gaps Visible
CloudBypass API helps developers pinpoint node-load imbalance by providing:
- regional micro-delay comparison
- handshake-phase timing layers
- per-resource drift charts
- node-path skew detection
- load-distribution variance snapshots
These reveal whether a slowdown comes from node-level behavior rather than actual traffic increases or network issues.
This makes debugging smoother, faster, and far more accurate.
FAQ
1. How do I know if a slowdown is node-related rather than bandwidth-related?
If latency remains stable but responses feel uneven or sequencing jitter increases, it’s likely node-load imbalance.
2. Why do only certain assets slow down during load-balance gaps?
Because different assets pass through different internal queues. Small gaps affect some queues more than others.
3. Can node-load balance gaps happen even during low traffic?
Yes — they often occur during internal updates or cache cycles unrelated to actual load.
4. Do these gaps happen globally or only regionally?
Usually regionally. Each region manages its own node clusters, so patterns differ dramatically by location.
5. How can CloudBypass API help diagnose these issues?
It exposes fine-grained timing drift, path variance, and node-specific processing asymmetry, making node-level slowdowns easy to identify.