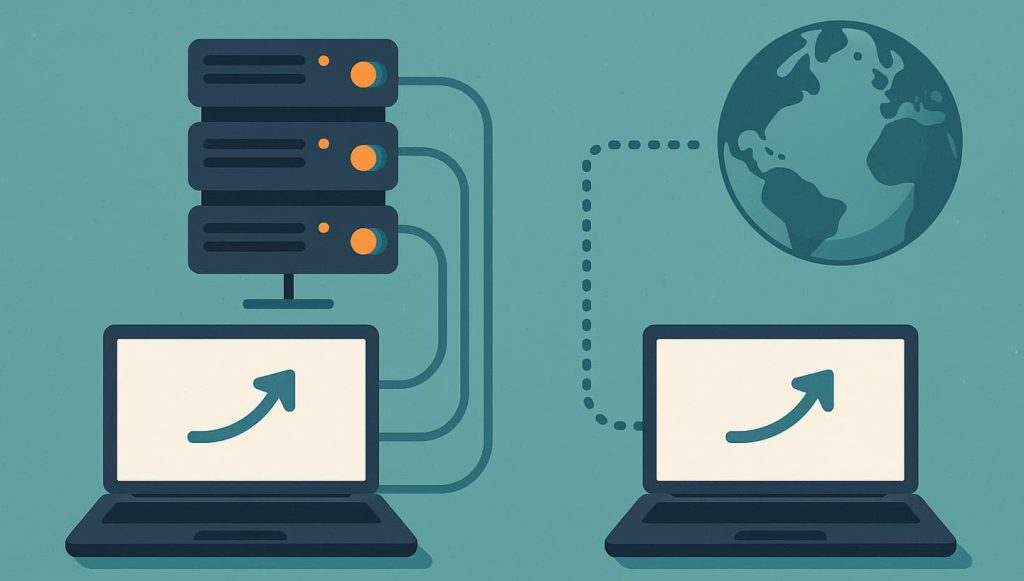
What Happens When Request-Phase Splits Show Up During High Traffic?
You might have seen this during peak hours:
The main request reaches the server quickly, but several follow-up phases — asset calls, authentication checks, API bursts, or resource hydration — suddenly fall out of sync.
Some parts stay fast, while others slow down for no obvious reason.
It feels like the request path “splits,” as if each phase starts obeying different timing rules.
This behavior is one of the most misunderstood patterns in high-traffic environments.
It’s not always congestion, not always backend load, and not always routing instability.
Request-phase splits often emerge from hidden timing layers that only activate under volume pressure.
In this article, we explore why request phases diverge under high traffic, what internal signals create this drift, and how CloudBypass API helps reveal the structure behind these seemingly random slowdowns.
1. Request Phases Don’t Share the Same Internal Path
A single user action triggers multiple phases:
- DNS
- handshake
- session tokens
- main document fetch
- async API calls
- embedded assets
- personalization workloads
Under load, each of these phases may be processed by different internal systems.
If even one system hits micro-pressure, timing splits appear immediately.
This explains why “the page loads but the widgets stall” is such a common pattern.
2. High Traffic Activates Deep Queue Segmentation
During low traffic, requests flow through shallow queues.
But once volume rises, many infrastructures switch into segmented queues:
- priority queues
- domain-specific buckets
- device-class separation
- policy-based routing streams
These segmentation rules allow systems to stay stable under load — but they also create different timing behaviors for different phases of the same request.
CloudBypass API exposes the moment these segments activate by comparing timing drift across phases.
3. Token and Session Checks Drift Under Stress
Authentication layers behave very differently at high volume:
- token validation depth increases
- expiration windows shorten
- per-region trust models tighten
- silent checks reappear
These changes don’t affect the main HTML fetch but do influence API calls made right after the page loads.
The result: phase divergence without traditional slowdowns.
4. Asset Delivery Paths Become Uneven
Static assets and dynamic APIs never share equal priority during peak hours.
Under pressure:
- CDN assets may stay hot and fast
- dynamic endpoints may slow
- mixed-content pages begin to desynchronize
- resource hydration pauses for timing alignment
You can load the skeleton of a page quickly but wait on scripts or widgets simply because they pass through more vulnerable layers.

5. Micro-Burst Effects Are Amplified Under High Load
When traffic is heavy, tiny bursts create bigger timing ripples:
- buffer rollover
- pacing resets
- TCP window corrections
- prefetch-pipeline resets
Ordinary behavior becomes exaggerated.
If the request hits a micro-burst during a phase change, it appears as a sudden stall even though overall throughput looks stable.
6. Backend Systems Prioritize “Critical Path” Traffic
During high volume, backends classify workloads into:
- critical
- near-critical
- non-critical
Main requests often stay in the critical class.
But embedded API calls or analytic events get downgraded temporarily, explaining why only certain phases slow down.
7. Edge Nodes Reassign Processing Layers
Under global pressure, edge nodes may:
- reshuffle their evaluation logic
- deepen normalization steps
- change caching behavior
- apply short-lived stricter policies
These shifts commonly influence post-document phases more heavily than the initial request.
CloudBypass API detects these oscillations because it captures both pre-fetch and post-fetch timing layers.
8. Client-Side Scheduling Breaks Under Timing Stress
High-traffic periods often align with device-side activity (e.g., busy hours).
Browsers under load experience:
- stalled event loops
- layout recalculation delays
- resource prioritization changes
This local behavior exaggerates timing splits that were already forming on the network side.
9. Why the Split Only Appears at Certain Times
Request-phase splits cluster around:
- regional busy hours
- carrier congestion windows
- CDN propagation cycles
- batch processing periods
- silent infrastructure updates
Everything looks fine at noon.
At 8 p.m., one phase falls behind.
At midnight, the system breathes again.
CloudBypass API identifies these time-bound patterns using timestamp-aligned sampling.
FAQ
1. Why do only some request phases slow down while others stay fast?
Because each phase moves through a different internal pipeline. Under high load, some pipelines face pressure while others stay clear.
2. Does this mean the system is overloaded?
Not necessarily. Phase splits often indicate controlled adaptive behavior rather than failure.
3. Why doesn’t latency reflect the slowdown?
Latency measures the outer shell of the request. Phase splits occur inside the system’s processing layers.
4. Could this be caused by my client or browser?
Partially — client-side scheduling can amplify the effect, but it’s rarely the root cause.
5. How can CloudBypass API help diagnose this?
It separates each request into timing layers, showing exactly when and where the split appears across regions or phases.